Your SAT Score Report has a lot of useful information but understanding what each score means and how they translate into actionable items to aid your college prep can be difficult. Our team of test prep experts has put together the following SAT Score Report guide to help families better understand their students’ SAT scores and how they can use these results to make informed decisions on how to proceed with test prep.
The Digital SAT Score Report
First, it’s important to understand the different scores that you will receive on your Score Report. Those scores include:
- Total Score – The sum of the two section scores. This score ranges from 400 to 1600. You may also see your score put into context with the average score at your school, district, state, country, and/or all testers.
- Section Scores – You will receive a score of 200 to 800 for the Reading and Writing section and the Math section.
- Knowledge and Skills – This section of the report breaks down your section scores so you can see how you did across the four content domains in each section.
Source: SAT
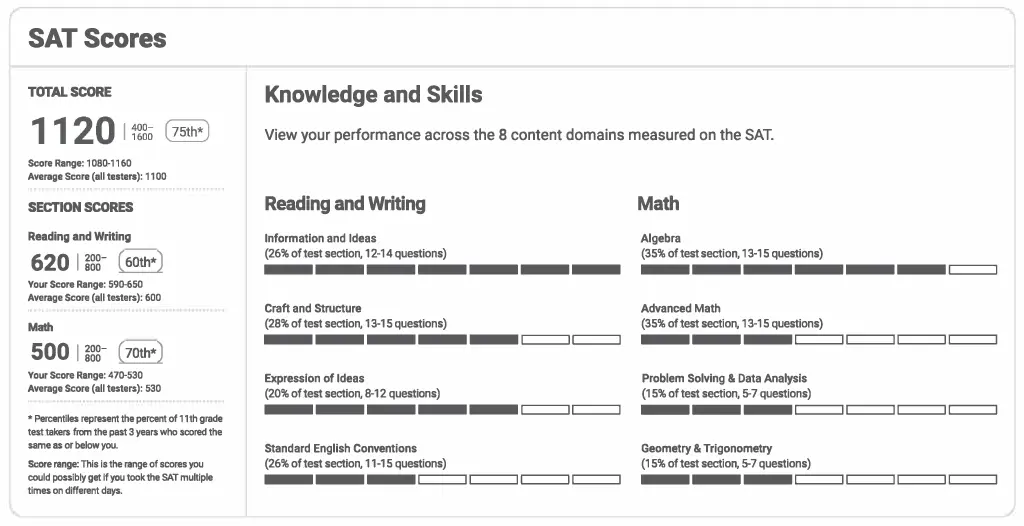
Total Score
In this sample report, the student has a total score of 1120, which puts them in the 75th percentile. What does that mean? Because the test taker in this example is in 11th grade, the percentile represents the percentage of high school juniors from the past three years who received less than or equal to this student’s score. If the student takes the test as a senior, the percentile will be based on 12th graders who took the test. You can also see in this example that the total score is compared to the average score of all testers, which is 1100.
Section Scores
Under the total score, you will see the section scores. In this case, the student scored a 620 on the Reading and Writing section — placing them in the 60th percentile — and a 500 on the Math section – putting them in the 70th percentile. Again, you will see how this student’s score in each section compares to the average score of all testers.
Score Ranges
Take a look at the score ranges, which you will see on the report under the total score and section scores. Score ranges show how much your score might change with repeated testing, assuming that your skill level remains the same. Typically, section scores for Reading and Writing and for Math fall in a range of 30 to 40 points above or below your true ability, so colleges receive the score ranges along with your scores to provide context.
Knowledge and Skills
Now that you have your total scores and section scores, you can look at the Knowledge and Skills section to see how you performed across the eight content domains on the test. On the SAT, you are tested on four content domains in each section:
- Reading and Writing: Information and Ideas, Craft and Structure, Expression of Ideas, and Standard English Conventions
- Math: Algebra, Advanced Math, Problem-Solving & Data Analysis, and Geometry & Trigonometry
In this example, the student performed the best in the Information and Ideas domain in the Reading and Writing section and the Algebra domain in the Math section.
This is valuable information, since it allows you to understand specific areas that need improvement. If you plan to take the test again, you can focus on these domains when you do your test prep.
Career Insights Snapshot
Aside from your scores, you will find an additional section on your score report called the Career Insights Snapshot — if you are attending a U.S. or non-U.S. DoDEA school, that is.
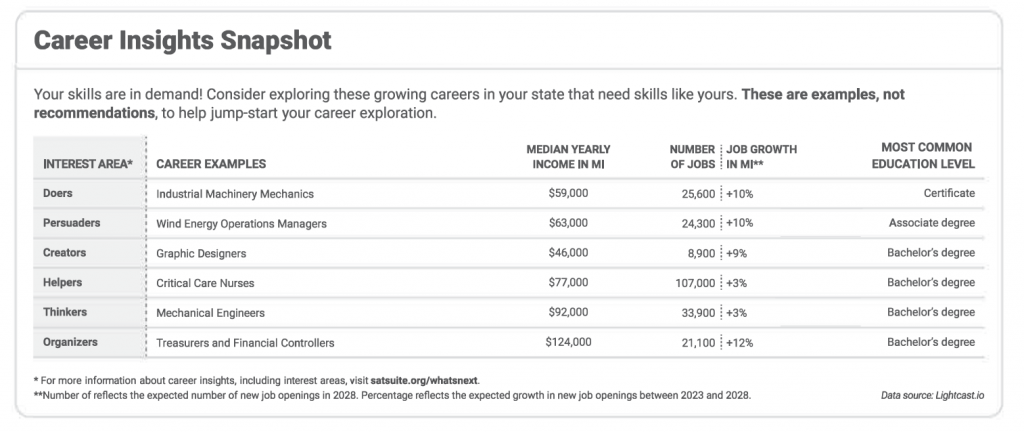
Source: SAT
This gives you insight into career fields that are growing in your state (if you’re stateside) or nationally (if you’re in a DoDEA school). These careers align with your SAT scores and the skills you demonstrated in the content domains; however, they are only suggestions. You can explore more potential careers at BigFuture.
Next Steps
Once you have an idea of what your scores mean, you can use this information to guide additional test prep and practice. Based on their performance on the exam, most students will choose to pursue some form of test prep before retaking the SAT in order to improve scores.
At IvyWise, our team of expert tutors can help students reach their goal scores by evaluating performance, identifying weaknesses, and developing a test prep plan to ensure they make the most of their time between exams. To learn more about our test prep services, contact us today.
Want to see how your SAT score compares to the ACT? Check out our SAT score conversion chart.